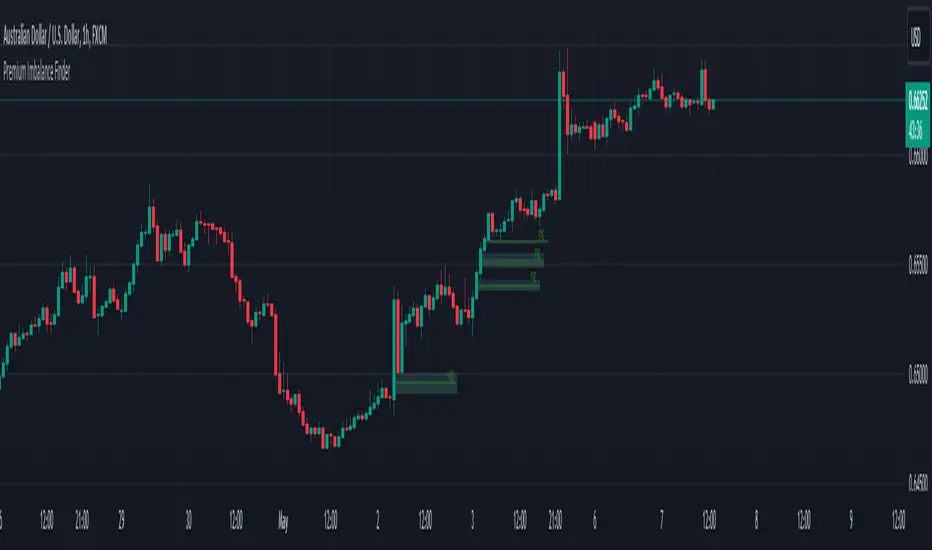
Premium Imbalance FinderIntroducing the Premium Imbalances Indicator, a powerful tool designed help traders identify and analyze market imbalances. This advanced indicator offers a comprehensive suite of features to enhance your trading experience and provide valuable insights into market dynamics.
Key Features:
Fair Value Gap (FVG): Identify price ranges where the market has not achieved fair value, indicating potential imbalances and trading opportunities.
Balanced Price Range (BPR): Visualize price ranges where the market has found a balance between supply and demand.
Volume Imbalance: Detect areas of significant volume imbalance, highlighting the absence of body volume and potential market inefficiencies.
Opening Gap: Identify un-offered price ranges at the opening of a trading session, providing insights into potential market direction.
Customizable Display: Adjust the display limit to control the number of imbalance boxes visible on the chart, ensuring a clutter-free and focused view.
Mitigation Analysis: Set a mitigation level to determine when an imbalance has been mitigated and track the percentage of mitigation for each imbalance.
Higher Timeframe Analysis: Enable the HTF Imbalance feature to analyze imbalances on higher timeframes, providing a broader perspective on market structure.
Customizable Appearance: Personalize the colors of imbalance boxes, premium zones, and mid-lines to suit your visual preferences and easily distinguish between bullish and bearish imbalances.
Flexible Imbalance Extension: Choose between custom, current, or extended imbalance box display to adapt to your trading style and analysis requirements.
Detailed Tooltips: Hover over imbalance labels to view the percentage of mitigation for each imbalance, providing quick and easy access to crucial information.
The Premium Imbalances Indicator is suitable for traders of all levels, from beginners to experienced professionals, and can be used across various markets and timeframes.
By utilizing this powerful tool, traders can gain a deeper understanding of market dynamics, identify potential trading opportunities, and make more informed decisions based on the analysis of imbalances. The indicator's customizable features and detailed insights make it an essential addition to any trader's toolkit.
在腳本中搜尋"supply and demand"
Imbalance Detector [LuxAlgo]This indicator detects and highlights market imbalances alongside a dashboard returning information about their frequency of occurrence and their fill percentage. Imbalances included in this script are Fair Value Gaps (FVG), Opening Gaps (OG) and Volume Imbalances (VI).
Alerts are available for the occurrences of all market imbalances.
Settings
Imbalances
Each imbalance has the same settings layout:
Imbalance: Enable/disable the detection of the specific imbalance.
Min Width: If enabled, requires the imbalance area width to be greater than the specified value. This minimum width can be expressed in points, percentages or ATR multiples.
Extend: Extend imbalances by a specified number of bars.
Dashboard
Show Dashboard: Enable/disable the dashboard on the chart.
Dashboard Location: Location of the dashboard on the chart.
Dashboard Size: Size of the dashboard.
Usage
Market imbalances are part of the many concepts available to price action traders and highlight areas where there is a disparity between supply and demand.
It is common to see price come back to these areas and traders often use them as supports and resistances but also as targets.
Details
The script can detect three distinct types of imbalances described below.
Fair Value Gaps
Fair Value Gaps (FVG) are three candle formations characterized by a gap between the wicks of the non-adjacent candles in the formation.
A bullish FVG is characterized by a gap between the current price low and the 2 bars anterior price high, and a bearish FVG is characterized by a gap between the current price high and the 2 bars anterior price low.
Opening Gaps
Opening Gaps (OG) are imbalances characterized by non-existent activity within a specific price range.
A bullish OG occurs when the current price low is greater than the previous high, a bearish OG occurs when price high is lower than the previous price low.
Opening Gaps primarily occur in closing markets, as such they are less common in the cryptocurrency market.
Most of the time an Opening Gap will also be accompanied by a Fair Value Gap, in order to avoid clutter the indicator will not detect Fair Value Gaps if Opening Gaps are enabled and if an Opening Gap has been detected
Volume Imbalances
Volume Imbalances (VI) are characterized by a price discontinuity between the opening price and previous close, but unlike Opening Gaps we do not see nonexistent activity within a certain price range.
A bullish VI occur when both the opening and closing prices are superior to the previous closing price, with the current price low overlapping the previous price high. A bearish VI occur when both the opening and closing prices are inferior to the previous closing price, with the current price high overlapping the previous price low.
Because Volume Imbalances can occur excessively on markets with frequent gaps, we make use of an additional condition for filtering out less significant imbalances. Bullish VI's will require the previous price high to be lower than the opening price, while bullish VI's will require the previous price low to be higher than the opening price.

Nonlinear Parametric Oscillator - PSOThis script is in development phase and may be buggy. use with your own risk. The idea here is to determine the sinusoidal directional changes in the supply and demand. Based on direction, you can enter and make huge gains. Recommended to use on 1 min chart. The sideways market would be indicated as flattening in the respective bands. There are four bands, bottom one is where market is in BEAR mode and top one is when market is in BULL mode.
The indicator doesnt work well when the ticker price is less than 10 dollars, i am working on it. Do not use on penny stocks, for the time. More-details when I make this a robust version.

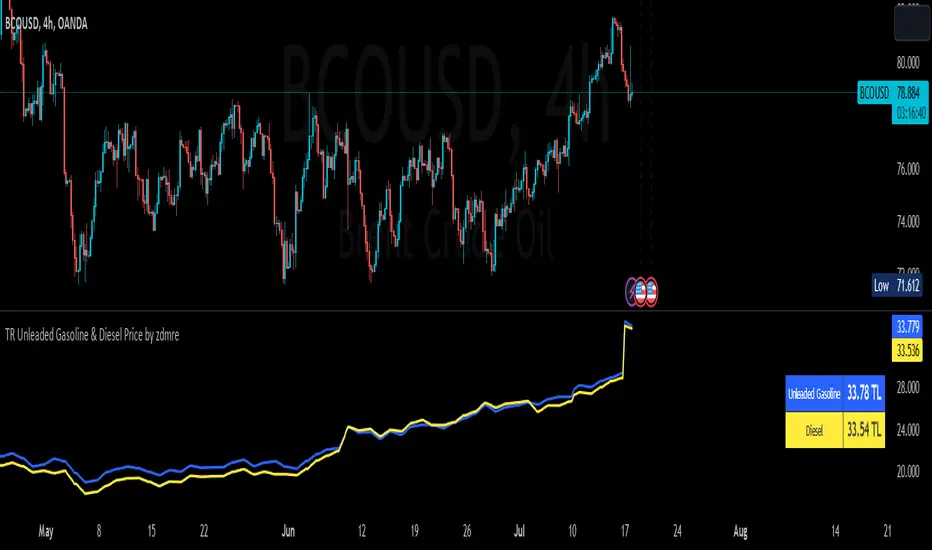
TR Unleaded Gasoline & Diesel Price by zdmreThe price of gasoline can change on any given day. Although a number of factors determine the price per liter, the price of crude oil makes the most impact. The per-barrel price of crude oil is most directly affected by world supply and demand. By closely monitoring the price of crude as well as keeping tabs on a few other factors you can estimate the cost to fill up.
Divide the crude oil (Moving Average) price by 159. One barrel of crude contains 159 liters. This will tell you the dollar amount per liter of refined gasoline attributed to crude. For example, if crude oil is $100 per barrel, then about $0.628 of the price of a liter of gas comes from the crude price.
By multiplying this amount by Dollar/Turkish Lira, special ratio and upper limit, you can get an estimated price per liter.
For example: using $0.628 , multiply by USD/TRY (17 TL), Special Ratio (2.1) and Upperlimit (1.03). An average cost per liter of gasoline is 23.09TL
The similar calculation applies to Diesel.
node nirvanaThis indicator is suitable for those who have studied Mr. Nirvana's course, as well as those who work in the style of supply and demand.

MT INDY S/R Hi guys i am glad to introduce this script to you guys you can use this for your day trading stratagey as supply and demand zones to make full use of it please combine this one with price action so that you guys have some more accuracy
HOW TO USE THIS ONE ?....
Well you can you this as major support and resistance for day trading the red coloured zone is called resistance zone or supply zones and the green coloured zone is called supply zones once the price attain that level we may expect a reversal and if it breakout the trend may continue

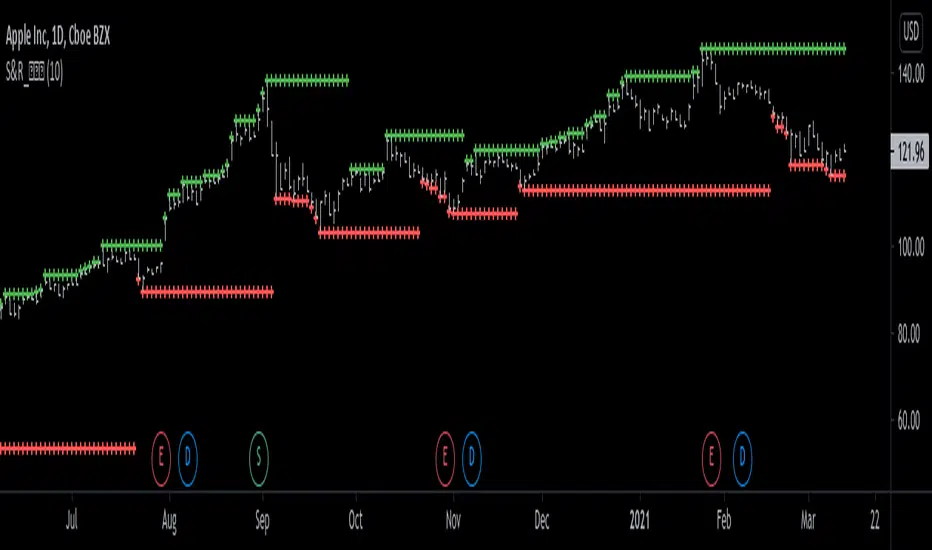
Support and Resistance Levels [racer8]One of the oldest concepts in trading. It's here guys. Drum roll please. Support & resistance baby! 🤣
So many requests from so many people asking me to build this. Finally. It is here guys 😀 Support and Resistance is here by racer8!
Indeed, S&R is used by so many traders. It is often one of the first concepts a trader will learn. I myself, can attest to this.
So what is support and resistance? 🤔
Good question, S&R are certain price levels that are created when a peak or trough has formed. Many traders use these peaks/troughs and extend lines out from them to create support & resistance levels.
Support levels are extended out from troughs. Resistance levels from peaks.
It is often believed that price bounces between these levels due to some unknown mysterious force known as supply and demand. 🙀
If you're a reversal trader, your strategy would likely be trying to short whenever price reaches a resistance level and vice versa for support levels.
If you're a trend trader, your strategy would likely be trying to go long whenever price breaks a resistance level and vice versa for support levels.
This Indicator...
Has one setting that controls which levels are formed. Higher settings equals less levels formed, but more important ones. Don't set it too high or too low. There is an optimal setting. Setting it too high will result in very few levels and thus, too little opportunities to trade. Setting it too low means the indicator will give you insignificant levels..also bad idea. So try to find something optimal like 10 to 20 periods for instance. 👍
Enjoy and have a blast!😀
Peace, I'm out! 🙏 💥
VPT_OBVThis is a derivation of the On Balance Volume Indicator.
The idea behind it is that volume consists of two parts. The driving theory is the basic law of supply and demand.
Part 1: Volume consists of shares traded at an equilibrium price. An equal number of buyers and sellers are present during this volume. This area is displayed as the upper and lower shadows on a single candlestick. For this indicator, volume traded in equilibrium is not included in the display.
Part 2: Volume consists of shares that are not traded at an equilibrium price, driving price up or down for the time period. In this volume, buyers or sellers are not present in equal numbers. This area is displayed as the body of the candlestick. This indicator focuses on this part of volume.
VPT_OBV plots only the volume that occurs at the difference in price between the open and the close. To achieve this, volume is divided by the difference between the high and the low (in pennies). Next, the difference between the open and close is calculated (in pennies). Volume is then divided by the difference in the high and low, to get the amount of volume needed to move the asset up or down by $0.01 during the time period. This number is then multiplied by the difference between the open and close.
VPT_OBV plots the outcome as a cumulative total. A simple moving average of the VPT_OBV is thrown in to provide smoothing.

BUYORSELLWIN📝 Usage Summary & Recommendations
Identify Zones: Use the red and blue boxes (Order Blocks) to identify key Supply and Demand Zones where price reversals are likely to occur.
Wait for Signals:
Conservative Entry: Wait for the price to approach the blue zone (Demand), then consider entering only when a reversal signal or the "Pa Tom's Action" (ป๋าต้อมสั่งลุย) signal appears.
Aggressive Entry: Trade immediately when the green or red "Pa Tom's Action" signal appears, especially if the signal aligns with the primary trend or occurs near an Order Block.
Set Alerts: This indicator has built-in automatic alerts. You will receive a notification whenever the "Pa Tom's Action" signal is triggered.
Risk Management: The "Pa Tom's Action" signal is highly aggressive and ultra-fast. Always use an appropriate Stop Loss. Despite the signal's name (which implies "going all-in"), do not literally bet your entire account. Always practice proper Risk Management.
คำแนะนำเพิ่มเติม:
ชื่อเฉพาะอย่าง "ป๋าต้อมสั่งลุย" ผมแปลทับศัพท์เป็น "Pa Tom's Action" เพื่อให้ดูเป็นสากล แต่ยังคงเอกลักษณ์เดิมไว้ครับ
คำว่า "อออินหมดตัว" ใช้คำว่า "bet your entire account" หรือ "go all-in" เพื่อให้สื่อความหมายในเชิงการลงทุนครับ

SMC POI Entry System HUDEntry, RR, Exit, of supply and demand zones taught in smart money trading. 12 types of zones and setups around Flips, Order Blocks, High Probability, and Extreme Demand Zones. Includes Checklist for Entry, Exit Rules, Take Profit Targets, Stop Loss spots, and Context

Binance Spot vs Perpetual Price index by BIGTAKER📌 Overview
This indicator calculates the premium (%) between Binance Perpetual Futures and Spot prices in real time and visualizes it as a column-style chart.
It automatically detects numeric prefixes in futures symbols—such as `1000PEPE`, `1MFLUX`, etc.—and applies the appropriate scaling factor to ensure accurate 1:1 price comparisons with corresponding spot pairs, without requiring manual configuration.
Rather than simply showing raw price differences, this tool highlights potential imbalances in supply and demand, helping to identify phases of market overheating or panic selling.
🔧 Component Breakdown
1. ✅ Auto Symbol Mapping & Prefix Scaling
Automatically identifies and processes common numeric prefixes (`1000`, `1M`, etc.) used in Binance perpetual futures symbols.
Example:
`1000PEPEUSDT.P` → Spot symbol: `PEPEUSDT`, Scaling factor: `1000`
This ensures precise alignment between futures and spot prices by adjusting the scale appropriately.
2. 📈 Premium Calculation Logic
Formula:
(Scaled Futures Price − Spot Price) / Spot Price × 100
Interpretation:
* Positive (+) → Futures are priced higher than spot: indicates possible long-side euphoria
* Negative (−) → Futures are priced lower than spot: indicates possible panic selling or oversold conditions
* Zero → Equilibrium between futures and spot pricing
3. 🎨 Visualization Style
* Rendered as column plots (bar chart) on each candle
* Color-coded based on premium polarity:
* 🟩 Positive premium: Light green (`#52ff7d`)
* 🟥 Negative premium: Light red (`#f56464`)
* ⬜ Neutral / NA: Gray
* A dashed horizontal line at 0% is included to indicate the neutral zone for quick visual reference
💡 Strategic Use Cases
| Market Behavior | Strategy / Interpretation |
| ----------------------------------------- | ------------------------------------------------------------------------ |
| 📈 Premium surging | Strong futures demand → Overheated longs (short setup) |
| 📉 Premium dropping | Aggressive selling in futures → Oversold signal (long setup) |
| 🔄 Near-zero premium | Balanced market → Wait and observe or reassess |
| 🧩 Combined with funding rate or OI delta | Enables multi-factor confirmation for short-term or mid-term signals |
🧠 Technical Advantages
* Fully automated scaling for prefixes like `1000`, `1M`, etc.
* Built-in error handling for inactive or missing symbols (`ignore_invalid_symbol=true`)
* Broad compatibility with Binance USDT Spot & Perpetual Futures markets
🔍 Target Use Cases & Examples
Compatible symbols:
`1000PEPEUSDT.P`, `DOGEUSDT.P`, `1MFLUXUSDT.P`, `ETHUSDT.P`, and most other Binance USDT-margined perpetual futures
Works seamlessly with:
* Binance Spot Market
* Binance Perpetual Futures Market

BTC HASHRATE DROP: OnchainWhy is the drop of hashrate important?
Drop of hashrate usually occurs because some miners in the mining network stop for working. There are several possible reasons for this. Such as new anti-mining regulations in some countries or a sharp drop in the price of bitcoin, which makes mining no longer affordable for some miners. So they turn off their devices
This reduces the supply of bitcoin in the market and according to the law of supply and demand can eventually lead to an increase in the price of bitcoin.
This oscillator is designed to detect hashrate drop. for this, we use the data of glassnode . Maroon color indicates decrease in hashrate and Red color indicates excessive hash rate drop. As can be seen on the chart, usually after this drop, we see an increase in the price of bitcoin

Multi-KI-Agenten Strategie FINAL-PROMulti-AI agent trading system, including EMA 50, 100 & 200, Fibonacci retracement, supply and demand, RSI, and much more. Simply add the data, set alerts, and you're ready to go.
Please use this system solely to confirm your own analyses. It should never be used as a 100% reference.

VPH - Volume Profile Heatmap (Visible Prices) [Da_Prof]The Volume Profile Heatmap (VPH) indicator is a dynamic volume visualization tool. Unlike traditional Volume Profiles that aggregate all historical data within a range, VPH focuses on recent price action. Specifically, it only considers the volume of the most recent time price touched a level. Additionally, it displays the volume as a heatmap where color intensity directly translates to volume density at specific price levels (as a percentage of the volume range).
What makes the VPH different than other volume profile indicators is its exclusion logic. If a high-volume node was created in the past, but the price has since crossed back through that level, the indicator disregards the previous volume. Therefore, it prioritizes the most recent market participants at any given price level. This is particularly useful for identifying:
1) Fresh Support/Resistance: Levels where volume has accumulated recently without being invalidated by a price cross-through.
2) Real-time Liquidity: Seeing exactly where the supply and demand reside in the current market structure in terms of volume transacted for the particular asset.
Main Features:
1) Dynamic Heatmap: Uses a multi-stage blue color gradient to represent volume intensity. Brighter, more vibrant cyan indicates high-volume nodes, while deep blues represent lower-activity zones. These default colors are best viewed on a black background. The colors can be customized through the settings.
2) Visible Range Scaling: The indicator automatically calculates the High and Low of your current screen view and adjusts the heatmap rows to fit perfectly within your visible window. Note: Ensure the indicator is pinned to the appropriate scale (likely the right scale). If the profile appears to not move when moving the chart, right click on the indicator and select the "pin to scale" to pin it to the appropriate scale.
3) Adjustable Resolution: Use the Number of Profile Bars input to increase the "granularity" of the heatmap (up to 400 rows).
4) Volume Thresholding: The Minimum Volume to Plot setting allows you to filter out "noise," showing only the price levels where significant market commitment occurred. The default is set at 50% of the range maximum.
How to use:
1) Identify high volume nodes: Look for the brightest cyan boxes. These represent price levels where the most recent heavy trading occurred. These areas are more likely to create a price reaction.
2) Spot thinly traded areas: Darker or empty areas indicate "low volume Nodes," where price moved quickly through. These often act as "vacuum" zones where price might travel through rapidly in the future.
3) Scroll & zoom to get the exact window of price action: The indicator is fully reactive. As you move your chart, it recalculates the heatmap based on the visible bars to provide a localized view of the current auction. This allows back testing of the indicator without using the "Replay" feature. Just put the historical price action you are interested in on your screen and the indicator will calculate the volume profile.

First Candle Range (FCR) Gold Strategy - EtubersThe 18:00 (6:00 PM) candle is widely used by traders in the Forex and Futures markets because it marks the New York market rollover and the start of the Asian session.
How the Strategy Works:
- The Range: The High and Low prices of the 1-hour candle (18:00–19:00) create a "Supply and Demand" zone.
- The Breakout: A candle closing above the high signals a bullish breakout; a candle closing below the low signals a bearish breakout.
- Institutional Memory: By extending this zone forward for 4 days, traders can identify where "old" 18:00 levels act as support or resistance in the future.
- Execution: Traders often wait for a breakout followed by a "retest" of the box boundary to enter a high-probability trade.

FVG Heatmap [Hash Capital Research]FVG Map
FVG Map is a visual Fair Value Gap (FVG) mapping tool built to make displacement imbalances easy to see and manage in real time. It detects 3-candle FVG zones, plots them as clean heatmap boxes, tracks partial mitigation (how much of the zone has been filled), and summarizes recent “fill speed” behavior in a small regime dashboard.
This is an indicator (not a strategy). It does not place trades and it does not publish performance claims. It is a market-structure visualization tool intended to support discretionary or systematic workflows.
What this script detects
Bullish FVG (gap below price)
A bullish FVG is detected when the candle from two bars ago has a high below the current candle’s low.
The zone spans from that prior high up to the current low.
Bearish FVG (gap above price)
A bearish FVG is detected when the candle from two bars ago has a low above the current candle’s high.
The zone spans from the current high up to that prior low.
What makes it useful
Heatmap zones (clean, readable FVG boxes)
Bullish zones plot below price. Bearish zones plot above price.
Partial fill tracking (mitigation progress)
As price trades back into a zone, the script visually shows how much of the zone has been filled.
Mitigation modes (your definition of “filled”)
• Full Fill: price fully trades through the zone
• 50% Fill: price reaches the midpoint of the zone
• First Touch: price touches the zone one time
Optional auto-cleanup
Optionally remove zones once they’re mitigated to keep the chart clean.
Fill-Speed Regime Dashboard
When zones get mitigated, the script records how many bars it took to fill and summarizes the recent environment:
• Average fill time
• Median fill time
• % fast fills vs % slow fills
• Regime label: choppy/mean-revert, trending/displacement, or mixed
How to use
Use FVG zones as structure, not guaranteed signals.
• Bullish zones are often watched as potential support on pullbacks.
• Bearish zones are often watched as potential resistance on rallies.
The fill-speed dashboard helps provide context: fast fills tend to appear in more rotational conditions, while slow fills tend to appear in stronger trend/displacement conditions.
Alerts
Bullish FVG Created
Bearish FVG Created
Notes
FVGs are not guaranteed reversal points. Fill-speed/regime is descriptive of recent behavior and should be treated as context, not prediction. On realtime candles, visuals may update as the bar forms.

Smart Money Bot [MTF Confluence Edition]Uses multi-time frame analysis and supply and demand strategy.
Best used when swing trading.

20MA / 200 MA Konvergenz & Elephant Bar FilterThe script creates a Momentum Filter designed to identify stocks that are currently exhibiting a transition from long-term price stability to short-term explosive volatility.
1. 🧘 Long-Term Stability Logic (Convergence)
The first part of the script identifies assets in a state of tight consolidation. This suggests that market participants have reached a temporary equilibrium, creating pent-up energy for a future trend.
A. Moving Average (MA) Proximity
The script checks if the fast MA (20 periods) and the slow MA (200 periods) are very close together.
It calculates the percentage difference, filtering for stocks where the separation between the two MAs is less than 2%. This defines the narrow range.
This condition confirms that the short-term and long-term price trends are essentially flat and aligned.
B. Price Nearness to the Long-Term MA
It further ensures that the current closing price is also within a tight range (e.g., less than 2%) of the 200-period MA.
This confirms the asset is actively trading at the center of the consolidation zone, simulating the "parallel" alignment of the MAs.
2. 💥 Explosive Breakout Logic (The Large Candle)
The second part of the script looks for the catalyst—an event that signals a sudden shift in supply and demand, ending the period of calm.
A. Above-Average Body Size
The script calculates the average absolute size of the candle body (the distance between open and close) over the last 20 periods.
It filters for stocks where the current candle body is at least three times (3x) larger than that historical average. This is the core signal of a powerful, convinced price move.
B. High Body-to-Range Ratio
To ensure the move was decisive and met little resistance, the script verifies that the candle body accounts for at least 85% of the candle's total range (high minus low).
This eliminates candles with long wicks (shadows), which would indicate volatility but a lack of directional conviction.
🎯 Summary
The combined screening identifies assets that have maintained long-term stability (MA convergence) but have just experienced a high-conviction, low-resistance breakout (Large Candle), indicating that a new, strong trend may be initiating.

Manual Zones SafeUse cases:
Support and resistance levels
Supply and demand zones
Price action areas for manual trading strategies

Ultimate_Price_Action_Tool_V2 by chaitu50cUltimate_Price_Action_Tool_V2 by chaitu50c — Session-Based SR Box Engine
This indicator builds clean, session-aware support and resistance “zones” from pure price action. It is designed for intraday and positional traders who want objective, rule-based zones instead of manual drawing.
Core Logic
Price-action based MAIN zones
Detects bullish and bearish breakouts using a strict body-structure:
Single-candle and double-candle breakout patterns.
Breakouts are confirmed only when closes break beyond previous highs/lows.
From each valid breakout, the tool builds a MAIN Support or MAIN Resistance box:
For bullish breaks, the zone is created from a combined low to the nearest open/close in the breakout combo.
For bearish breaks, the zone is created from a combined high to the nearest open/close in the breakout combo.
Optional first-box logic:
Can create the very first MAIN zone in a session from a simple opposite-color pair (without a full breakout), if enabled.
SUB zones on break
When price breaks a MAIN Support downwards with a red candle, the MAIN box is removed/frozen and:
A new SUB Resistance box is created above, using the current bar’s structure.
When price breaks a MAIN Resistance upwards with a green candle:
A new SUB Support box is created below.
SUB zones are optional and can be fully disabled if the user prefers a clean MAIN-only view.
Session Handling
The script is fully session-aware and can work in different market structures:
Session Mode options
Clock Session
Uses a fixed time window (e.g., 09:15–15:30).
Zones can be shown only inside the session or kept visible outside, depending on settings.
New Day
Each new trading day is treated as a fresh session.
Auto Gap
A new session starts whenever the time gap between candles exceeds a user-defined threshold (in minutes).
Session IDs and history
Each new session gets its own ID.
You can display zones for the last N sessions (including current).
Older sessions fade out visually but remain internally tracked to control visibility.
Main Features & Options
Initial Right Offset
Every new zone is projected to the right by a configurable number of bars.
All active boxes continuously extend with this offset, keeping zones clearly projected into the future.
Single MAIN per side (per session)
Optional constraint to have only:
One active MAIN Support and
One active MAIN Resistance
per session on the chart.
This prevents overcrowding and focuses on the most recent key structure.
MAIN vs SUB Overlap Control
When a new MAIN zone overlaps an existing SUB zone, you can choose:
Suppress MAIN (ignore the new MAIN if it clashes with a SUB),
Remove SUB (delete overlapping SUB zones and keep the new MAIN), or
Allow Both (plot everything and let the trader decide).
Vertical overlap is evaluated using a configurable minimum overlap percentage.
SUB suppression under MAIN
SUB boxes that overlap strongly with active MAIN zones can be auto-suppressed to avoid redundant clutter.
This suppression uses the same percent-based overlap logic.
Broken MAIN box handling
When a MAIN zone is broken:
Option 1: Fully delete it (classic behavior).
Option 2: Convert it into a 1-bar “marker” box at its origin, so you still see where the original zone formed without extending into the future.
Break candle coloring
The candle that breaks a MAIN zone can be optionally painted:
Red when breaking support.
Green when breaking resistance.
Helps visually confirm genuine breaks vs. simple intrabar tests.
Visual & Styling Controls
Separate style controls for:
MAIN Support / MAIN Resistance
Independent fill and border colors.
SUB Support / SUB Resistance
Independent fill and border colors.
Opacity and border colors are internally managed so that:
Recent sessions are clearly visible.
Older sessions are softly faded to maintain context without noise.
Typical Use Cases
Intraday traders looking for:
Clean, rule-based supply and demand zones.
Zones that respect actual session structure (clock, daily, or gap-based).
Swing traders who:
Want to track how current price reacts to the most recent 1–N sessions’ zones.
Price action traders who:
Prefer breakout-based zones rather than indicator-driven levels.
Need automatic zone management (creation, extension, break handling, and suppression).
This tool is built to be modular and configurable: you can run it minimal (only MAIN zones, single side per session) or fully featured (MAIN + SUB, multi-session history, overlap handling, and break paints). All logic is strictly price-action based with no dependency on volume or external indicators.

Viprasol Elite Advanced Pattern Scanner# 🚀 Viprasol Elite Advanced Pattern Scanner
## Overview
The **Viprasol Elite Advanced Pattern Scanner** is a sophisticated technical analysis tool designed to identify high-probability double bottom (DISCOUNT) and double top (PREMIUM) patterns with unprecedented accuracy. Unlike basic pattern detectors, this elite scanner employs an AI-powered quality scoring system to filter out false signals and highlight only the most reliable trading opportunities.
## 🎯 Key Features
### Advanced Pattern Detection
- **DISCOUNT Patterns** (Double Bottoms): Identifies bullish reversal zones where price may bounce
- **PREMIUM Patterns** (Double Tops): Detects bearish reversal zones where price may decline
- Multi-point validation system (5-point structure)
- Symmetry analysis with customizable tolerance
### 🤖 AI Quality Scoring System
Each pattern receives a quality score (0-100) based on:
- **Symmetry Analysis** (32% weight): How closely the two bottoms/tops match
- **Trend Context** (22% weight): Strength of the preceding trend using ADX
- **Volume Profile** (22% weight): Volume confirmation at key points
- **Pattern Depth** (16% weight): Significance of the pattern's price range
- **Structure Quality** (16% weight): Overall pattern formation quality
Quality Grades:
- ⭐ **ELITE** (88-100): Highest probability setups
- ✨ **VERY STRONG** (77-87): Strong trade opportunities
- ✓ **STRONG** (67-76): Valid patterns with good potential
- ○ **VALID** (65-66): Acceptable patterns meeting minimum criteria
### 🎯 Intelligent Target System
Three target modes per pattern direction:
- **Conservative**: 0.618 Fibonacci extension (safer, closer targets)
- **Balanced**: 1.0 extension (moderate risk/reward)
- **Aggressive**: 1.618 extension (higher risk/reward)
Targets automatically adjust based on pattern quality score.
### 🔧 Advanced Filtering Options
- **Volatility Filter (ATR)**: Excludes patterns during extreme volatility
- **Momentum Filter (ADX)**: Ensures sufficient trend strength
- **Liquidity Filter (Volume)**: Confirms adequate trading volume
### 📊 Pattern Lifecycle Management
- Real-time neckline tracking with extension multiplier
- Pattern invalidation after extended wait period
- Breakout/breakdown confirmation
- Reversal detection (pattern failure scenarios)
- Target achievement tracking
### 🌈 Premium Visual System
- Color-coded quality levels
- Cyber-themed color scheme (Neon Green/Hot Pink/Purple/Cyan)
- Transparent fills for pattern zones
- Dynamic labels with pattern information
- Elite dashboard showing live pattern stats
## 📈 How To Use
### Basic Setup
1. Add indicator to your chart
2. Enable desired patterns (DISCOUNT and/or PREMIUM)
3. Adjust quality threshold (default: 65) - higher = fewer but better signals
4. Set your preferred target mode
### Trading DISCOUNT Patterns (Bullish)
1. Wait for pattern detection (labeled points 1-4)
2. Check quality score on dashboard
3. Entry on breakout above neckline (point 5)
4. Stop loss below the lowest bottom
5. Target shown automatically based on your mode
6. ⚠️ Watch for pattern failure (break below bottoms = SHORT signal)
### Trading PREMIUM Patterns (Bearish)
1. Wait for pattern detection (labeled points 1-4)
2. Check quality score on dashboard
3. Entry on breakdown below neckline (point 5)
4. Stop loss above the highest top
5. Target shown automatically based on your mode
6. ⚠️ Watch for pattern failure (break above tops = LONG signal)
## ⚙️ Input Settings Guide
### 🔍 Detection Engine
- **Left/Right Pivots**: Higher = fewer but cleaner patterns (default: 6/4)
- **Min Pattern Width**: Minimum bars between bottoms/tops (default: 12)
- **Symmetry Tolerance**: Max % difference allowed between levels (default: 1.8%)
- **Extension Multiplier**: How long to wait for breakout (default: 2.2x pattern width)
### ⭐ Quality AI
- **Min Quality Score**: Only show patterns above this score (default: 65)
- **Weight Distribution**: Customize what matters most (symmetry/trend/volume/depth/structure)
### 🔧 Filters
- **Volatility Filter**: Avoid choppy markets (recommended: ON)
- **Momentum Filter**: Ensure trend strength (recommended: ON)
- **Liquidity Filter**: Volume confirmation (recommended: ON)
### 💎 Target System
- Choose target aggression for each pattern type and direction
- Higher quality patterns get adjusted targets automatically
## 🎨 Visual Customization
- Adjust colors for DISCOUNT/PREMIUM patterns
- Set quality-based color coding
- Customize label sizes
- Toggle dashboard visibility and position
- Show/hide historical patterns
## 🚨 Alert System
Set up TradingView alerts for:
- 🚀 **LONG Signals**: DISCOUNT breakout, PREMIUM failure
- 📉 **SHORT Signals**: PREMIUM breakdown, DISCOUNT failure
- ✅ **Target Achievement**: When price hits your target
## 💡 Pro Tips
1. **Higher Timeframes = Better Signals**: Patterns on 4H, Daily, Weekly are more reliable
2. **Quality Over Quantity**: Focus on ELITE and VERY STRONG grades
3. **Combine with Trend**: DISCOUNT in uptrend, PREMIUM in downtrend = best results
4. **Watch Pattern Failures**: Failed patterns often provide strong counter-trend signals
5. **Adjust for Your Style**: Intraday traders use Conservative, swing traders use Aggressive
## 🔒 Pattern Invalidation
Patterns become invalid if:
- No breakout/breakdown within extension period
- Support/resistance levels are broken prematurely
- Pattern shown in faded colors = no longer active
## ⚠️ Risk Disclaimer
This indicator is a tool for technical analysis and does not guarantee profitable trades. Always:
- Use proper risk management
- Combine with other analysis methods
- Never risk more than you can afford to lose
- Past performance does not indicate future results

Etwas31 Precision zones and trendTitle: Etwas31 Precision zones and trend
Overview: Get a complete market overview at a single glance. This script combines a comprehensive trend/volatility dashboard with automated, high-precision supply and demand zones. It filters out noise and highlights key market structures to improve your trading accuracy.
Key Features:
1. 📊 Advanced MTF Dashboard (5m - 1W)
Trend Monitor: Uses EMA 20 & 50 alignment to accurately detect Bullish, Bearish, or Neutral (Choppy) markets. No more guessing the trend.
Volatility Scanner: Utilizing ATR logic, it signals whether the market is active (High ⚡) or dormant (Low 💤) for each timeframe.
2. 🎯 Precision Support & Resistance Zones
Real Structure: Unlike simple lines, zones are drawn based on candle wicks (High to Body / Low to Body) to reflect the actual "thickness" of market interest.
Visual Hierarchy:
Weak Zones (15m, 30m): Displayed as Hollow/Dashed boxes. Ideal for scalping or short-term targets.
Strong Zones (1H, 4H, 1D, 1W): Displayed as Solid/Filled boxes. These are key levels for reversals and major trend continuation.
Auto-Extension: Zones automatically extend to the current price action for easy tracking.
3. ⚙️ Customizable & Clean
Fully customizable colors and visibility settings.
Optimized to prevent chart clutter while providing maximum information.
How to Use:
Use the Dashboard to align your trades with the higher timeframe trend (e.g., trade with the 4H trend).
Wait for Volatility (⚡) to confirm momentum.
Enter trades when price reacts at Solid Zones (Strong S/R) or use Hollow Zones for intraday scalp targets.

ICS🏛️ Institutional Confluence Suite (ICS) Indicator
The Institutional Confluence Suite is a powerful and highly customizable TradingView indicator built to help traders identify key institutional trading concepts across multiple timeframes. It visualizes essential market components like Market Structures (MS), Order Blocks (OB)/Breaker Blocks (BB), Liquidity Zones, and Volume Profile, providing a confluence of institutional price action data.
📈 Key Features & Components
1. Market Structures (MS)
Purpose: Automatically identifies and labels shifts in market trends (Market Structure Shift, MSS) and continuations (Break of Structure, BOS).
Timeframe Detection: You can select detection across Short Term, Intermediate Term, or Long Term swings to match your trading horizon.
Visualization: Plots colored lines (Bullish: Teal, Bearish: Red) to mark the structures and optional text labels (BOS/MSS) for clear identification.
2. Order & Breaker Blocks (OB/BB)
Purpose: Detects and projects potential Supply and Demand zones based on recent price action that led to a swing high or low.
Block Types: Distinguishes between standard Order Blocks and Breaker Blocks (OBs that fail to hold and are traded through, often serving as support/resistance in the opposite direction).
Customization:
Detection Term: Adjusts sensitivity (Short, Intermediate, Long Term).
Display Limit: Sets the maximum number of recent Bullish and Bearish blocks to display.
Price Reference: Option to use the Candle Body (Open/Close) or Candle Wicks (High/Low) to define the block boundaries.
Visualization: Displays blocks as colored boxes (Bullish: Green, Bearish: Red) extending into the future, with a dotted line marking the 50% equilibrium level. Breaker Blocks are indicated by a change in color/line style upon being broken.
3. Buyside & Sellside Liquidity (BSL/SSL)
Purpose: Highlights areas where retail stops/limit orders are likely clustered, often represented by a series of relatively equal highs (Buyside Liquidity) or lows (Sellside Liquidity).
Detection Term: Adjustable sensitivity (Short, Intermediate, Long Term).
Margin: Uses a margin (derived from ATR) to group similar swing points into a single liquidity zone.
Visualization: Plots a line and text label marking the swing point, and a box indicating the clustered liquidity zone.
4. Liquidity Voids (LV) / Fair Value Gaps (FVG)
Purpose: Identifies areas where price moved sharply and inefficiency was created, often referred to as Fair Value Gaps or Imbalances. These are price ranges where minimal trading volume occurred.
Threshold: Uses a multiplier applied to the 200-period ATR to filter for significant gaps.
Mode: Can be set to Present (only show voids near the current price) or Historical (show all detected voids).
Visualization: Fills the price gap with colored boxes (Bullish/Bearish zones), often segmented to represent the price delivery across the gap.
5. Enhanced Liquidity Detection
Purpose: A complementary feature that uses volume and price action to highlight areas of high liquidity turnover, potentially indicating stronger Support and Resistance zones.
Calculation: Utilizes a volume-weighted approach to color-grade liquidity zones based on their significance.
Visualization: Plots shaded boxes (gradient-colored) around swing highs/lows, with text displaying the normalized volume strength.
6. Swing Highs/Lows
Purpose: Directly marks the price points identified as Swing Highs and Swing Lows based on the lookback periods.
Timeframe Detection: Can be enabled for Short Term, Intermediate Term, or Long Term swings.
Visualization: Plots a small colored dot/label (e.g., "⦁") at the swing point.
This indicator is an invaluable tool for traders employing ICT (Inner Circle Trader), Smart Money Concepts (SMC), or general price action strategies, as it automatically aggregates and displays these critical structural and liquidity elements.
